Today we talked about the CHARACTERISTICS of narratives (stories). Most students did not know how to answer this question at the beginning of the year. Now you do. Knowing the characteristics of a text form or how it is organized (non-fiction) helps you understand it better. If you are reading a narrative (story) and you're not sure you understand it, trying to identify the characteristics will help.
All narratives have..... characters, setting and a plot. Those are the three main characteristics. In the plot (what happens in the story) we have the problem or conflict, the climax and the resolution. The climax is more of a grade five characteristic. It is the most exciting part.... where we find out the resolution. Some stories don't have much of a climax, so it's not one I would usually ask you to identify.

I loved both of the mentor texts we read today. The language was incredible and the stories were so creative. Remember the words of advice Eva's neighbours gave her about writing a story.....
"The whole world's a stage--- and each of us plays a part. Watch the stage, observe the players carefully, and don't neglect the details."
"Try to find poetry in your pudding. there's always a new way with old words."
"Use your imagination. If your story doesn't go the way you want it to, you can always stretch the truth. You can as 'What if?' and make up a better story."
"Add a little action. Like soup. A little this. A little that. And don't forget the spice. Mix it. Stir it. Make something happen. Surprise yourself."
What do you think will happen at the end of "My Rotten Red-Headed Brother"?
Math
We talked about surveying in grade five. Specifically we discussed how to identify the population our survey applies to. Because we cannot survey an entire population, we use a RANDOM, REPRESENTATIVE SAMPLE. Keep the following in mind when completing your homework:
• A population is the whole group of people or things you want to
learn about.
• Choose
a good sample to represent the whole population.
- If you choose a good sample,
you can use the data that you collect to draw conclusions about the whole
population.
- A random sample can represent
the population.
• Make
sure your survey question is clear. That way, everyone will understand what you
are asking and give answers that you can use to draw conclusions.
• Plan
how you will collect the data.
• Ask
questions that do not suggest that one answer is better than another and that
do not influence people’s responses.
• Allow
people to choose not to participate.
• Be
sure to keep track of the information you gather.
population: the entire group you want to
learn about by collecting data; for example, if you want to know how the
students at a school would like to celebrate a special day, the population is
all the students at that school
random: describes an outcome that cannot
be predicted with any certainty
representative: a survey sample that has
characteristics similar to the entire population; for example, a sample that
includes students in each class could be representative of all the students in
a school, while a sample that includes only Grade 6 students would not
sample: a small group selected from a
larger group (or population) for the purposes of collecting data about the
larger group
survey: a record of observations about a
group of people gathered by asking questions or interviewing some of the people
in the group
Here is the Action Task:
Collecting Useful Data: ACTION
1. Think of an issue you might be interested in collecting data about.
You will plan a survey to collect the data.
2. Describe
the population you want to learn about.
3. a) Think of a sample you could
use that would not help you learn
about the whole population. Explain why it would not be a good sample.
b) How could you improve the
sample?
4. a) Think of a question you could
ask that would not help you learn
about the issue you chose. Explain why it would not be a good question to ask.
b) How could you improve the
question?
Are there other issues about collecting the data that might not help you learn what you want?
Lesson
Summary
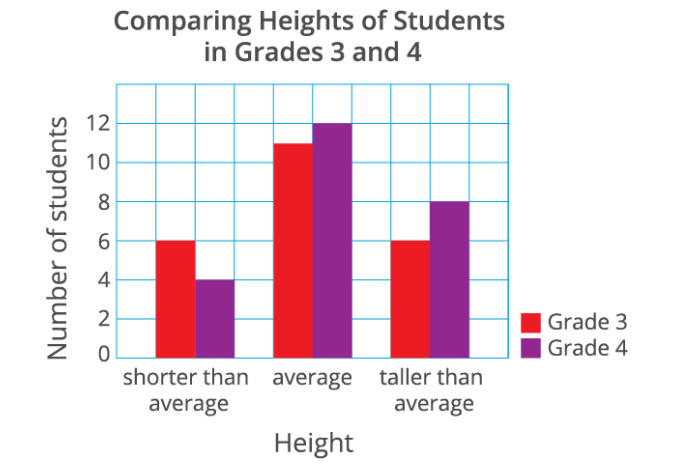
• When
you want to show similar data about two groups at the same time, it might make
sense to use a double bar graph.
• On
a double bar graph, each category has two bars: one for one group and one for
the other group. That way, each set of data can be described separately, and
the two sets can be compared.
For
example, a double bar graph might show the number of children in a school by
grade who are shorter than average, average, and taller than average.
Key Terms
double bar graph: a type of bar graph used to compare two sets of data that have been
organized into categories
Please finish Your Turn Questions for Stem and Leaf Plots and plan your survey question and tables to collect your data. Remember you are conducting your survey of two classes tomorrow so you can only complete #1 and set up the table for #2.
Here are the links to the questions:
https://www.mathup.ca/share?code=eyJHcmFkZUlkIjoiNSIsIlRvcGljSWQiOiI1NyIsIkxlc3NvbklkIjoiNDAwIiwiUGF0aElkIjoiMCIsIlBhcnQiOiJXaGF0IHlvdSBMZWFybmVkIiwiU2VjdGlvbiI6MiwiU2VjdGlvblRpdGxlIjoiWW91ciBUdXJuIFF1ZXN0aW9ucyIsIlVzZXIiOiI0NDkzOkpvLUFubmUgSG9sbGlzIiwiRGF0ZSI6IjkvMjMvMjAxOSIsIkFsbG93TmF2IjpmYWxzZX0
https://www.mathup.ca/share?code=eyJHcmFkZUlkIjoiNSIsIlRvcGljSWQiOiI1NyIsIkxlc3NvbklkIjoiNDAxIiwiUGF0aElkIjoiMCIsIlBhcnQiOiJBY3Rpb24iLCJTZWN0aW9uIjoxLCJTZWN0aW9uVGl0bGUiOiJBY3Rpb24gVGFzayIsIlVzZXIiOiI0NDkzOkpvLUFubmUgSG9sbGlzIiwiRGF0ZSI6IjkvMjMvMjAxOSIsIkFsbG93TmF2IjpmYWxzZX0
Reminders:
- Permission form for class trip to Upper Thames Conservation Area next Monday. We will need parent volunteers so if your parent can help, please have them write a note in your agenda.
- Permission forms for cross country meets.
- Math test signed and goals /next steps recorded on tracking sheet in your assessment folder.
- TOONIE(S) FOR TERRY FOX RUN ON WEDNESDAY.